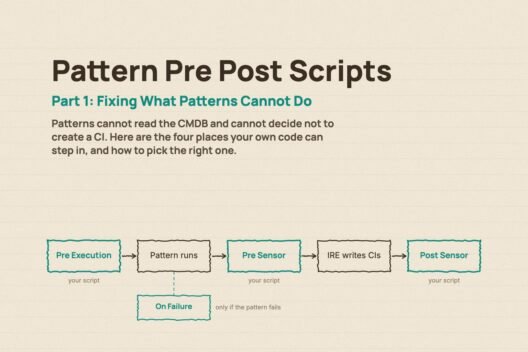

Part 1 covered what Pre Post Processing Scripts are, the four types, and how to decide between pre sensor and post sensor. This part is the hands-on half: what the payload looks like, a post sensor script that runs in production, how to debug it, and the traps I have hit doing this in the field.
What the payload looks like
Everything a pre sensor or post sensor script does starts with the payload, so look at one before writing a line of logic. Create a script with nothing in it but a log statement:
gs.info('GT_PAYLOAD ' + payload);Run the pattern, then open System Logs › System Log › Script Log Statements and search for your prefix. You will see a JSON document with an items array. Each item is one CI the pattern discovered, and each has a className (the CMDB table), a values map holding the attributes the pattern collected, and in a post sensor script a sysId for the record the IRE wrote. Relationships between items sit alongside, referencing items by their position in the array.
Two habits from the start. Always prefix your log lines with something unique so you can find them among thousands of Discovery entries. And log the payload at the top and bottom of the script during development, so you can see exactly what your code changed.
A post sensor script for VM Lifecycle Stage and Status
Here is a post sensor script that runs in production today on the Linux Server and Windows OS – Servers patterns.
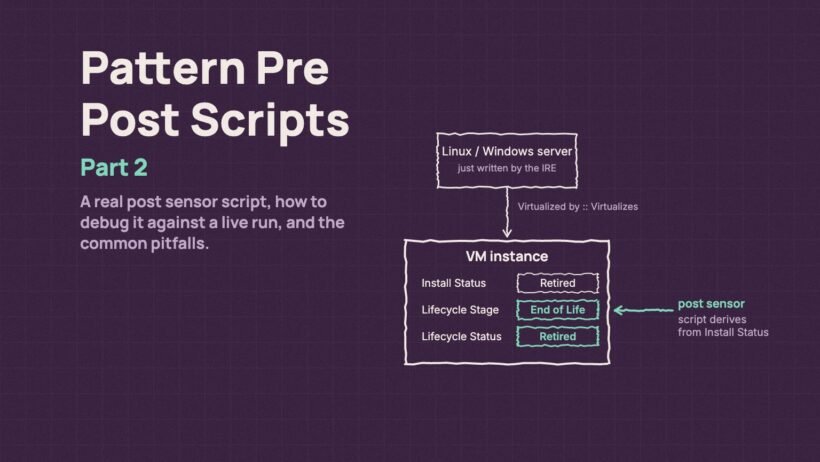
The problem it solves: Discovery populates the Install Status on a VM instance, but nothing populates Lifecycle Stage and Lifecycle Stage Status. Those two fields were a business requirement at this client, driven by CSDM lifecycle governance, and they were sitting empty on every discovered VM. I wrote about what those fields mean in an earlier post on CMDB lifecycle. The rule was simple: derive them from Install Status. Retired means End of Life and Retired, anything else means Operational and In Use.
This has to be post sensor. The script needs the sys_id of the server the IRE just wrote, and then it follows the Virtualized by::Virtualizes relationship from that server to its VM instance. Neither of those exists until the IRE has finished.
The obvious question is why not a Business Rule on cmdb_ci_vm_instance. An insert rule alone is not enough, because Install Status changes on later runs when a VM is retired, so you would need it on update as well. That means it fires on every write to the table from every source: imports, integrations, manual edits, other scripts. On a large CMDB that is a lot of executions to enforce a rule that only Discovery ever triggers. The post sensor script runs once, at the moment Discovery has just touched that VM’s server, it is attached only to the two patterns that matter, and its result shows up in the discovery log next to the run that caused it. Keeping discovery-driven logic in the discovery flow also means nobody has to go hunting through Business Rules to understand why a lifecycle field changed.
If you had VMs arriving from sources other than Discovery and needed the same derivation for them, then a Business Rule would be the right tool, or both.
var rtrn = {};

var payloadObj = JSON.parse(payload);
payload = null;

var serverClasses = ['cmdb_ci_linux_server', 'cmdb_ci_win_server'];
var message = 'No server item in payload, nothing to do';

var getDiscoveredServerSysId = function() {
    for (var i = 0; i < payloadObj.items.length; i++) {
        var item = payloadObj.items[i];
        if (serverClasses.indexOf(item.className) !== -1 && item.sysId) {
            return item.sysId;
        }
    }
    return '';
};

var getRelTypeSysId = function(name) {
    var gr = new GlideRecord('cmdb_rel_type');
    gr.addQuery('name', name);
    gr.query();
    return gr.next() ? gr.getUniqueValue() : '';
};

var findVMInstance = function(serverSysId, relTypeSysId) {
    var rel = new GlideRecord('cmdb_rel_ci');
    rel.addQuery('parent', serverSysId);
    rel.addQuery('type', relTypeSysId);
    rel.query();
    while (rel.next()) {
        var vm = new GlideRecord('cmdb_ci_vm_instance');
        if (vm.get(rel.getValue('child'))) {
            return vm;
        }
    }
    return null;
};

var syncLifecycle = function(vm) {
    var retired = vm.getValue('install_status') == '7';
    var stage = retired ? 'End of Life' : 'Operational';
    var status = retired ? 'Retired' : 'In Use';
    if (vm.getValue('life_cycle_stage') == stage && vm.getValue('life_cycle_stage_status') == status) {
        return 'VM lifecycle already correct, no update';
    }
    vm.setValue('life_cycle_stage', stage);
    vm.setValue('life_cycle_stage_status', status);
    vm.update();
    return 'VM lifecycle set to ' + stage + ' / ' + status;
};

var serverSysId = getDiscoveredServerSysId();

if (serverSysId) {
    var relTypeSysId = getRelTypeSysId('Virtualized by::Virtualizes');
    var vm = relTypeSysId ? findVMInstance(serverSysId, relTypeSysId) : null;
    message = vm ? syncLifecycle(vm) : 'No VM instance related to server ' + serverSysId;
}

rtrn = {
    status: {
        message: message,
        isSuccess: true
    },
    patternId: patternId,
    payload: JSON.stringify(payloadObj)
};
What it does, in order. It finds the server item in the payload, Linux or Windows, and takes the sys_id the IRE assigned to it. These patterns run once per target, so there is exactly one server per payload. It looks up the Virtualized by::Virtualizes relationship type by name, then queries cmdb_rel_ci for relationships where that server is the parent and loads the child from cmdb_ci_vm_instance. Querying that table by sys_id already covers every class that extends it, so no separate class check is needed. Finally it derives the VM’s Lifecycle Stage and Status from its Install Status: install status 7 (Retired) becomes End of Life and Retired, anything else becomes Operational and In Use.
Three things to notice.
payload = null right after the parse is the memory-saving pattern the OOB scripts use, and it is the reason the payload variable looks empty if you try to read it later in the script. Work from payloadObj.
The script compares before it writes. Discovery runs on a schedule, and without that check the VM would be updated on every cycle even when nothing changed, firing business rules and adding audit noise for no reason.
The status message says what actually happened: no server in the payload, no related VM, already correct, or updated to what. That message lands in the discovery log, which saves a trip to the script logs when you are checking a run.
Debugging
Log statements get you most of the way. Prefix them with something unique, log the payload at the top and bottom of the script while you are developing, and read them under System Logs › System Log › Script Log Statements.
When that is not enough, the Script Debugger can be attached to a real discovery run. Set breakpoints in your script, open the discovery log, go to the ECC Queue related list, open the input record for the pattern execution, and choose Run Again (Debug). The debugger halts at your first breakpoint with the real payload in front of you. You need the discovery_admin role, and the Run Again (Debug) UI Action is restricted to maint out of the box, so change its condition in a sub-production instance first.
Stopping the debugger reprocesses the payload for real, so keep this to sub-production. The debugger cannot reach anything running on the MID Server.
Common pitfalls
The payload variable is null. Many OOB pre post scripts now set payload to null once they have parsed it, to free memory on large payloads. If you copy the skeleton from one of those scripts and add your logic after that line, you will be working with nothing. Either parse before it is cleared or read from the parsed object. In post sensor scripts the data is also available through the payloadRecords GlideRecord, whose ie_output field holds the IRE result. The Solaris relationship script from my earlier post reads it that way.
The template comment lies. When you create a new script the pre-filled comment block says “Pre sensor” whether you are writing a pre or post sensor script. The lifecycle script above still carried that comment in production for months. The record’s When to execute field is the truth. Delete the comment so the next person doesn’t trust it.
The read-only “horizontal only” flag. Each script record shows a flag saying it applies to horizontal discovery only. In practice these scripts run for Service Mapping too. Do not let the flag talk you out of using one for a top-down scenario.
Pre Execution scripts not firing. Pre execution scripts do not run through the same hook as pre and post sensor scripts. I have seen instances where they were attached correctly and never executed. If you depend on one, prove it fires with a log line before you build on it.
Wanting the MID Server name. The payload does not carry the name of the MID Server that produced it. If you need to stamp a CI with where it was discovered from, a post insert Business Rule on the CI table can read that from the record, or you can look it up in the ECC queue from a post sensor script.
isSuccess false is all or nothing. It stops the whole payload, not one item. To drop one CI and keep the rest, remove that item from payloadObj.items in a pre sensor script and leave isSuccess true.
That is the whole feature. Two gaps in what patterns can do, four places to put your own code, one real script, and a handful of pitfalls to watch for. Once you have written one of these scripts the next one takes an afternoon.