
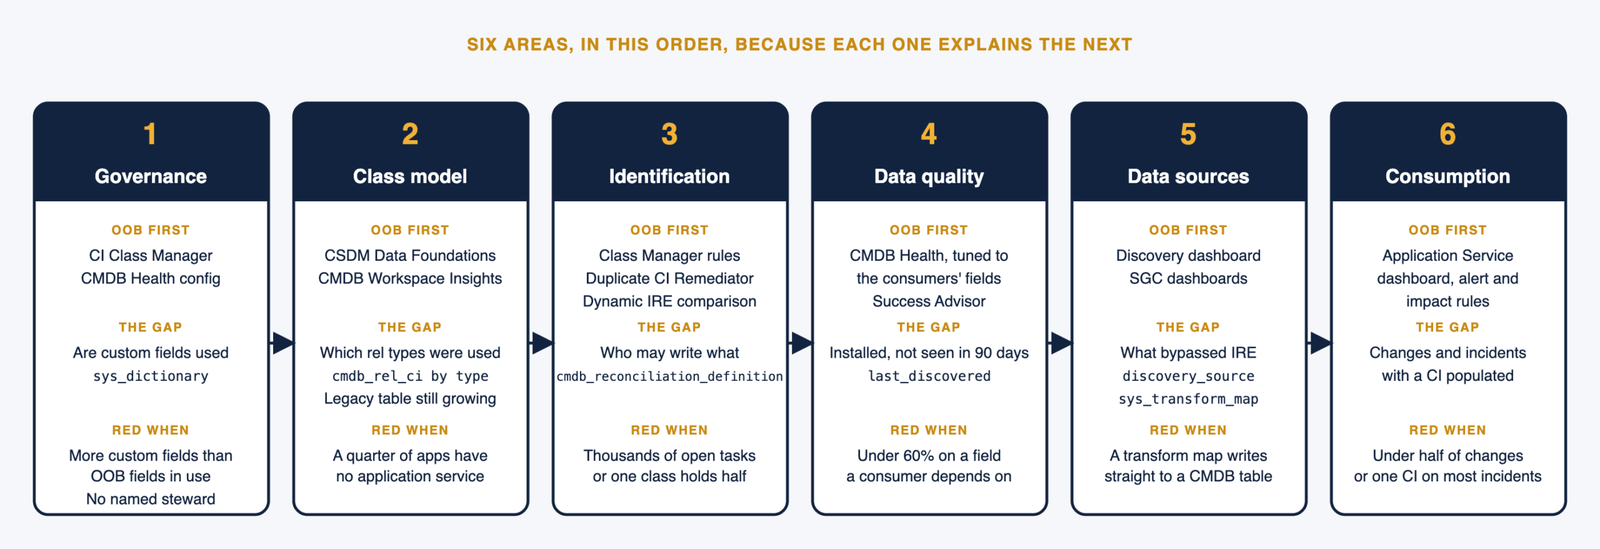
Every CMDB assessment I have been asked to do started with the same sentence from the sponsor. “We do not trust the data.” That is a feeling, not a finding, and the job of the assessment is to turn it into a list of specific things that are wrong, ranked by what they cost, with a fix against each. Over the years the way I do that has settled into a fixed shape. Six areas, two weeks, one report, and for each area the OOB tool that already answers most of the question, plus the one or two list views for what it does not.
That last point matters. ServiceNow ships more assessment tooling than most teams use. CMDB Health, the CSDM Data Foundations dashboard, the Duplicate CI Remediator, the Discovery and Service Graph Connector dashboards and, from the Australia release, the CMDB Success Advisor. An assessment that ignores them and writes scripts instead is doing the platform’s work badly, and slower. An assessment that only reads their dashboards misses the questions they were not built to ask. The checklist below uses both, in that order.
Before you open the instance
Three things first, because the instance will tell you what is broken but not why anyone cares.
Who consumes the CMDB today. Not who should, who does. Incident and change management, Service Mapping, Event Management, SAM, security tooling, an external reporting team. Each consumer has a different definition of good data, and the assessment has to be scored against theirs.
What the sponsor decided was out of scope, in writing. Assessments expand. Agree the classes and the data sources up front, and agree that the report will name gaps outside scope without investigating them.
Who owns what. If nobody can tell you who owns the server class, that is your first finding and it is a governance finding, not a data one.
Area 1. Governance and ownership
The questions. Is there a named CMDB owner. Is there a data steward per major class or per data source. Is there a change process for the class model. Is there a definition of done for a CI.
OOB first. CI Class Manager shows the whole hierarchy with custom classes visible at a glance, and for each class whether it has an identification rule of its own. A custom class with records and no rule is a finding on its own. CMDB Health’s configuration, under Configuration and CMDB Health in the navigator, tells you whether anyone has ever tuned the completeness metrics to the consumers’ fields or left the OOB set running.
What OOB does not tell you is whether the custom fields are used. For each major class, list its dictionary entries that start with u_, then for each one count the records where the field is populated. A field added three years ago and populated on 2 percent of records is a field nobody needed.
Thresholds. Green is under ten custom fields per major class, all populated above 80 percent, with a named steward. Red is more custom fields than OOB fields in use, or any custom field populated on under 10 percent of records.
Area 2. Class model and CSDM alignment
The questions. Which CSDM stage does the instance actually sit at, whatever the slide says. Are business applications, application services and technical services present and distinct. Are relationships built with the CSDM relationship types.
OOB first. The CSDM Data Foundations dashboard, installed from the Store, is built for exactly this. It scores the instance against the CSDM stages, counts each service layer, and lists business applications without application services and application services without CIs. If it is not installed, installing it on the clone is the first hour of this area. CMDB Workspace’s Insights view gives the application service counts by type and the relationship health. In Service Graph Workspace on Australia, the same data is under the CMDB context.
What OOB does not show cleanly is which relationship types have actually been used between the layers, and whether the legacy generic service table is still being written to. Open cmdb_rel_ci, filter to relationships whose parent is a business application and whose child is an application service, and group by type. The CSDM answer is Consumes::Consumed by. Anything else in that grouping is a finding. Then open cmdb_ci_service, filter to records whose class is exactly the generic service class, created in the last ninety days. Any rows mean something is still writing to the table CSDM retired.
Thresholds. Green is under 5 percent of business applications without a service and under 10 percent of application services empty, from the Data Foundations dashboard. Red is over a quarter on either, or the legacy table still growing.
Area 3. Identification and reconciliation
The questions. How many identification rules have been customised, and does anyone know why. Which data sources are trusted for which attributes. How big and how old is the duplicate backlog.
OOB first. CI Class Manager, Identification Rule per class, shows the rule and its entries with a clear marker for whether it is OOB or modified. The Duplicate CI Remediator under CMDB Workspace, Health, shows the backlog by class, task age and the number of CIs in each group, and it is where the remediation happens, so its numbers are the ones to report. CMDB Health’s Correctness tab includes the duplicate metric with its own trend. On Australia, if Dynamic IRE has been simulated, the comparison view in the Hardware class’s Identification Rule page gives the parity score and the disagreements.
Reconciliation is the gap. The Remediator does not tell you whether a data source is allowed to write an attribute, and an empty reconciliation table means last writer wins. Open cmdb_reconciliation_definition, filter to active, and group by class. A class fed by three data sources with no reconciliation rule is where attributes flip every night.
Also read the identification engine properties in sys_properties, the ones whose name starts with glide.identification_engine, because someone has usually changed one and forgotten.
Thresholds. Green is an open backlog under 200 tasks with nothing older than ninety days. Red is thousands of tasks, tasks older than a year, or one class carrying more than half the backlog, which almost always points to one weak identifier entry on that class.
Area 4. Data quality
The questions. For the classes the consumers care about, how complete, how correct and how current is the data. Not the overall health score, the specific fields.
OOB first, and this is where OOB does the most. CMDB Health has Completeness (required and recommended fields populated), Correctness (duplicates, orphans, staleness, audit failures) and Compliance (desired state audits). The dashboard is only useful if the metrics were configured for your consumers, so the first step is to open the CMDB Health configuration and add the consumers’ fields as required attributes on the classes they care about, then run the health jobs on the clone. That turns the dashboard from a generic score into the assessment’s data quality section. Staleness is a Correctness metric with a configurable threshold, orphans are a Correctness metric that already does the expensive relationship scan nightly so you never write it yourself, and results land in cmdb_health_result where you can report on them by class and field.
CMDB Success Advisor on Australia sits on top of this with recommendations for principal classes, hardware assets and software installs, and it is worth screenshotting its three dashboards for the report.
One list I always build by hand because it is the single most telling number on the instance. Servers with install status Installed whose last_discovered is older than ninety days or empty. Run it for every class your consumers depend on.
I put every completeness number in a table with the consumer who needs the field in a column beside it, so the sponsor can see which team is affected by which gap.
Thresholds. Green is above 90 percent on consumer defined required fields and under 5 percent stale. Red is under 60 percent on any field a consumer depends on, or more than a fifth of installed servers not discovered in ninety days.
Area 5. Data sources and integrations
The questions. What feeds the CMDB, in what order, and does the order match the trust. Which sources create CIs and which only update. Has anything been bypassing IRE.
OOB first. The Discovery dashboard shows schedule coverage, run history and error counts per schedule. Each Service Graph Connector has its own dashboard in CMDB Workspace with last run, records processed and errors, and IntegrationHub ETL shows the same for custom connectors. CMDB Workspace lists the registered data sources and their discovery source names. Export discovery_schedule and put the ranges beside the network ranges the infrastructure team says exist. The gap is usually cloud accounts and a data centre that moved.
What none of those dashboards show is what bypassed them. Two checks. First, open cmdb_ci, exclude retired records, and group by discovery_source. That tells you who actually created the CIs, and an empty discovery source on thousands of records means something wrote them without identification. Second, open sys_transform_map, filter to active maps whose target table starts with cmdb_ci. That is what wrote them.
Every hit is a finding unless the map hands off to the identification API in its transform script. A transform map writing straight to cmdb_ci_server explains a large share of the duplicates from area three, and I have found one on more instances than not.
Thresholds. Green is every CI carrying a discovery source, no active transform map targeting a CMDB table directly, and schedules covering every range the network team names. Red is the transform map.
Area 6. Consumption and value
The questions. Is the CMDB actually used where the business case said it would be. Does change management pick affected CIs from it. Does impact analysis run on it.
OOB first. The Application Service dashboard in CMDB Workspace shows which services have had incidents and changes against them. Event Management’s alert rules and impact rules list which application services are referenced. If report usage statistics are enabled on the instance, they show whether anyone outside the CMDB team runs reports on CMDB tables.
The headline numbers come from two list views. Changes created in the last ninety days, and how many of them have a Configuration Item populated. Incidents the same. Two counts each, one division.
Then the follow up that matters more than the percentage. Group those incidents by Configuration Item. If one CI carries a third of all incidents it is a default somebody set, not a real selection.
Thresholds. Green is above 80 percent of changes with an affected CI and a spread of CIs across incidents. Red is under half of changes with a CI, or a single CI on most incidents.
The checklist in one table
| Area | OOB tool first | Then the gap check | Where the evidence lands |
|---|---|---|---|
| Governance | CI Class Manager, CMDB Health configuration | Custom field population, custom class list | Class hierarchy, health configuration |
| Class model | CSDM Data Foundations dashboard, CMDB Workspace Insights | Relationship type distribution, legacy cmdb_ci_service growth | Data Foundations scores |
| Identification | CI Class Manager rules, Duplicate CI Remediator, Dynamic IRE comparison | cmdb_reconciliation_definition, identification properties | Remediator backlog by class |
| Data quality | CMDB Health configured to consumer fields, Success Advisor | Stale servers list | cmdb_health_result |
| Data sources | Discovery dashboard, SGC dashboards, data source list in CMDB Workspace | discovery_source grouping, sys_transform_map | Schedule coverage vs network ranges |
| Consumption | Application Service dashboard, alert and impact rules | Changes and incidents with a CI | Task tables |
How long and in what order
Two weeks for an instance of normal size. Days one and two are interviews and scoping, and I do not open a single dashboard until I know who consumes the data. Day three is setup on the clone, meaning CMDB Health configured to the consumers’ fields and run, and Data Foundations installed if it is missing, because the OOB tools need a day to produce numbers. Days four to eight are the six areas in the order above, because each one explains part of the next. Days nine and ten are writing.
What the report looks like
One page the sponsor reads and ten they do not. The one page has the six areas each scored red, amber or green against the consumers’ needs, the five findings that cost the most, and the three fixes that unblock the most. The ten pages have the evidence, the dashboard screenshots and the list counts, so that the fix teams can start without repeating the assessment.
The scoring is deliberately not a single number. A CMDB is not 62 percent healthy. It is fine for change management, unusable for licence reconciliation and dangerous for impact analysis, and the report should say which.
The finding that is always there
Somewhere in every assessment is a gap between what people believe the CMDB contains and what it contains. The class model on the slide has three service layers and the instance has one. The discovery schedule covers the data centre and nobody added the cloud accounts. The business applications were loaded from a spreadsheet years ago and half have since been retired. The platform already has the tools to find all of this. The assessment is mostly the discipline of switching them on, pointing them at the right fields, and writing down what they show.