
The application score is the number everyone argues about. An application owner sees a 4.2 next to their system, asks where it came from, and the honest answer on most implementations is “the scoring profile”. That is not an answer. This article is the answer. What the job reads, how each indicator is normalized, how the weights combine, when the number is written, and why it sometimes is not written at all.
The pieces
A scoring profile is a set of indicators with a weight on each. A business application has exactly one profile assigned. An indicator is a single measure, Business Value or Technical Risk or Application TCO, with a direction (higher is better, or lower is better) and a Frequency. The profile turns many indicator values into one score per application.
Five tables hold all of it.
| Table | What it holds |
|---|---|
apm_metric | Indicators, both application and capability |
apm_application_profile | Scoring profiles |
apm_application_profile_indicator | Which indicators belong to which profile, and the weight |
apm_app_indicator_score | One score per indicator per application per fiscal period |
apm_app_score | The final aggregated score per application per period |
Capability scoring reuses the same tables. Capability indicators live in apm_metric too, the navigation just splits them into two lists, and capability scores land in apm_app_score with the profile’s ci_class set to cmdb_ci_business_capability.
Step one, normalize each indicator to a 1 to 10 scale
Raw indicator values are on different scales. TCO is in currency, incidents are a count, CSAT is a survey figure. Before they can be combined, each is normalized across all the applications being evaluated.
Maximize (highest raw value scores 10):
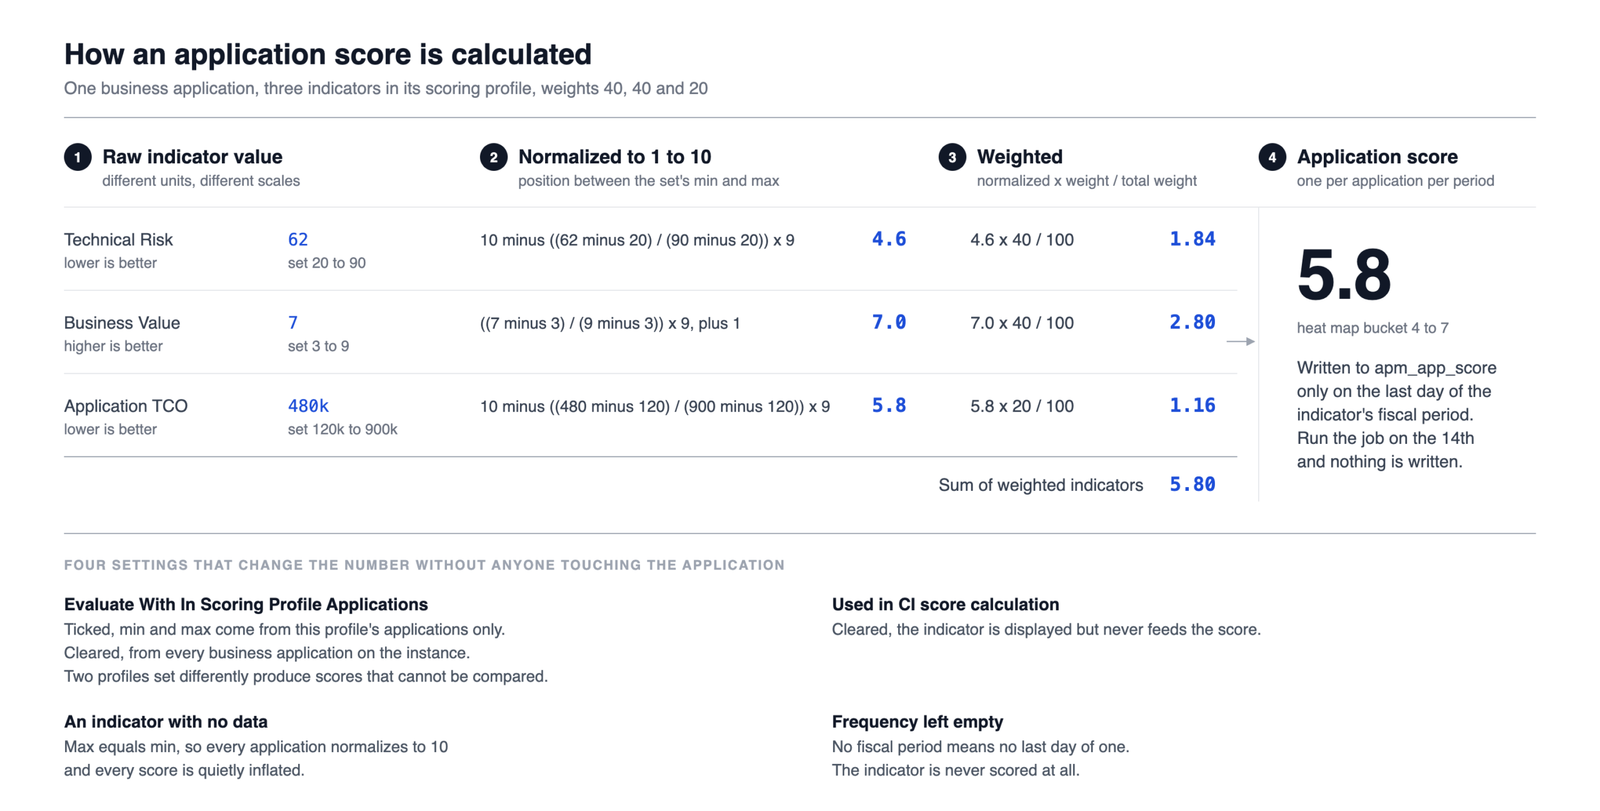
normalized = (((value - min) / (max - min)) * 9) + 1

Minimize (lowest raw value scores 10):
normalized = 10 - (((value - min) / (max - min)) * 9)

All applications equal (max equals min):
normalized = 10
Two consequences of this that matter in practice. First, every score is relative. An application’s Technical Risk score is not a statement about that application, it is a statement about where it sits between the best and worst application in the set. Add a much riskier application to the portfolio and everyone else’s risk score improves without anything changing. Second, min and max depend on which applications are in the set, which is controlled by a checkbox on the profile’s indicator list. Evaluate With In Scoring Profile Applications. Ticked, the set is only the applications assigned to this profile. Cleared, it is every business application on the instance across all profiles. Two teams comparing scores from different profiles with this box set differently are not comparing the same thing.
The other checkbox, Used in CI score calculation, decides whether the indicator feeds the final score at all or is only displayed.
Step two, weight and combine
indicatorScore = normalized * indicatorWeight / totalProfileWeightThe application score is the sum across indicators. The documentation says the weights in a profile should total 100. The formula divides by the actual total, so 100 is a convention rather than a constraint. The documented worked example uses three indicators at 33 each, total 99, and it works fine. I still make them total 100, because a profile whose weights total 100 is one the business can read as percentages, and the point of the score is that the business trusts it.
Step three, the job, and when it writes
Load Application Indicators and compute Application Scores does the work. It recalculates every indicator, every profile those indicators belong to, and every application and capability attached to those profiles. Capability scores roll up from the leaf capabilities as a mean up the hierarchy. The heat map buckets are 7 to 10, 4 to 7, 0 to 4, and -1 for unscored.
Here is the part that produces the most confusion. The job writes a score for an indicator only on the last day of that indicator’s fiscal period, as set in the indicator’s Frequency field. Monthly indicators produce a score on the last day of the month. Quarterly ones on the last day of the quarter. Run the job on the 14th and it does nothing for a monthly indicator, successfully.
So two rules. Set Frequency on every indicator, because an indicator with no Frequency is never scored. And tell the customer on day one that scores appear at period end, not on the day the job runs.
Setting the job up is specific. Open it under All, System Definition, Scheduled Jobs, set Run (Daily, Weekly or Monthly), set Time, set Run as to System administrator, save from the form header, then Execute Now.
The incident and change indicators need three properties
Several OOB indicators count incidents, problems and changes per application. Those counts come from Performance Analytics, and PA reads the Business Application related list on incident and change records. That list is populated only when three properties are true.
com.snc.incident.refresh_impacted.include_affected_cis
com.snc.incident.populate_business_application
com.snc.change_request.populate_business_application
With any of them false, the PA jobs collect nothing, the scoring job runs clean, and every application looks perfectly stable. Set the properties, then run [PA Incident] Daily Data Collection, [PA Change] Daily Data Collection and [PA Problem] Daily Data Collection, then the scoring job, in that order.
Regeneration deletes
The Regenerate scores buttons on an application indicator, a profile indicator or a capability indicator do not update existing scores. They delete the scores for the period and create new ones, daily scores included. Regenerating a quarter in production wipes that quarter’s history first. Do it in sub production, or accept the gap.
Which indicators drive which chart
The Application Rationalization bubble charts are pairs of indicators, configured in apm_bubble_chart (X indicator and Y indicator only, the other fields are ignored in EA Workspace).
| Chart | X | Y |
|---|---|---|
| Customer Satisfaction vs Functional Fit | CSAT | Functional Fit |
| Functional Fit vs Business Value | Functional Fit | Business Value |
| Technical Risk vs Application TCO | Technical Risk | Application TCO |
| Technical Risk vs Business Value | Technical Risk | Business Value |
| Usage vs Customer Satisfaction | Usage | CSAT |
If a new indicator does not appear in the bubble size list, it is inactive. And the chart shows at most sn_apm_ws.appRationalizationMaximumBubbles applications, 500 by default. Assess more than that and the extras are silently absent.
How I set profiles up
Copy the default business application scoring profile rather than editing it, so the OOB one stays as a reference. Attach only the indicators the customer will actually collect data for. An indicator with no data normalizes to 10 for everyone and quietly inflates every score. Set weights to total 100. Set Frequency on each indicator to the cadence the source data actually refreshes at. Then run the PA jobs and the scoring job once at period end and walk the customer through one application’s number, indicator by indicator, before showing them the chart.
Scoring is the last configuration step in the Enterprise Architecture implementation sequence, because every indicator reads data the earlier steps produce.